针对气候变化的严峻形势,我国提出“双碳”重大战略目标[1],环境CO2浓度的控制得到重点关注。CO2对温室效应的贡献占55%[2],大量CO2排放导致全球气候变暖,造成风暴、海平面上升、农作物质量和数量下降等问题[3-4]。不仅如此,CO2还可能引起一定的健康风险。Robertson[5]指出全球变暖并不是大气中CO2浓度上升最严重的结果,CO2有长期的毒性,会对人类生命造成威胁。Satish等[6]通过研究发现CO2是一种容易被忽视的室内污染物,而不仅仅是室内空气质量的替代指标。CO2暴露浓度增加会对人类健康构成各种直接风险,《室内空气质量标准》(GB/T 18883—2002)[7]将室内CO2日均浓度标准值规定为1 000 mg·L-1。所处环境CO2浓度达到1 000 mg·L-1时,人会感到沉闷、注意力不集中、心悸;达到1 500~2 000 mg·L-1时,人会感到气喘、头痛和眩晕;达到2 000~5 000 mg·L-1时,人会感到头疼、嗜睡和呆滞;达到5 000 mg·L-1及以上时,可能造成缺氧、脑损伤、昏迷甚至死亡[8]。有研究表明,暴露于高浓度CO2(>1 000 mg·L-1)2.5 h会影响人的认知、决策以及问题解决等能力;长期暴露于高浓度CO2会引起炎症、呼吸酸中毒等症状,甚至可能增加肥胖、糖尿病患病风险[5,9-11]。因此,监测个体CO2暴露对健康防护具有重要意义。目前已有大量关于环境CO2浓度水平相关研究[12-13],而关于个体CO2实时暴露研究较少[14-15]。
城市居民每天有约70%~90%的时间在室内度过[16],室内CO2浓度水平至关重要。室内暴露又可分为住宅暴露、办公场所暴露和其他室内环境暴露等。除了室内暴露,居民暴露场所还有室外暴露和交通出行暴露[17]。因此,使用总体暴露(耦合暴露环境及暴露时间)来评估相关健康风险更合理[18]。本研究将城市居民主要活动微环境中的CO2实时浓度与活动轨迹相结合,探究其CO2实时暴露特征,量化家庭成员个体暴露差异,确定不同微环境对居民CO2暴露贡献,并计算暴露强度。以此研究结果为参考,可评估城市居民CO2暴露风险、关注存在过度暴露风险的群体以及为减少个体CO2暴露提供建议。
1 材料与方法(Materials and methods)
1.1 志愿者家庭
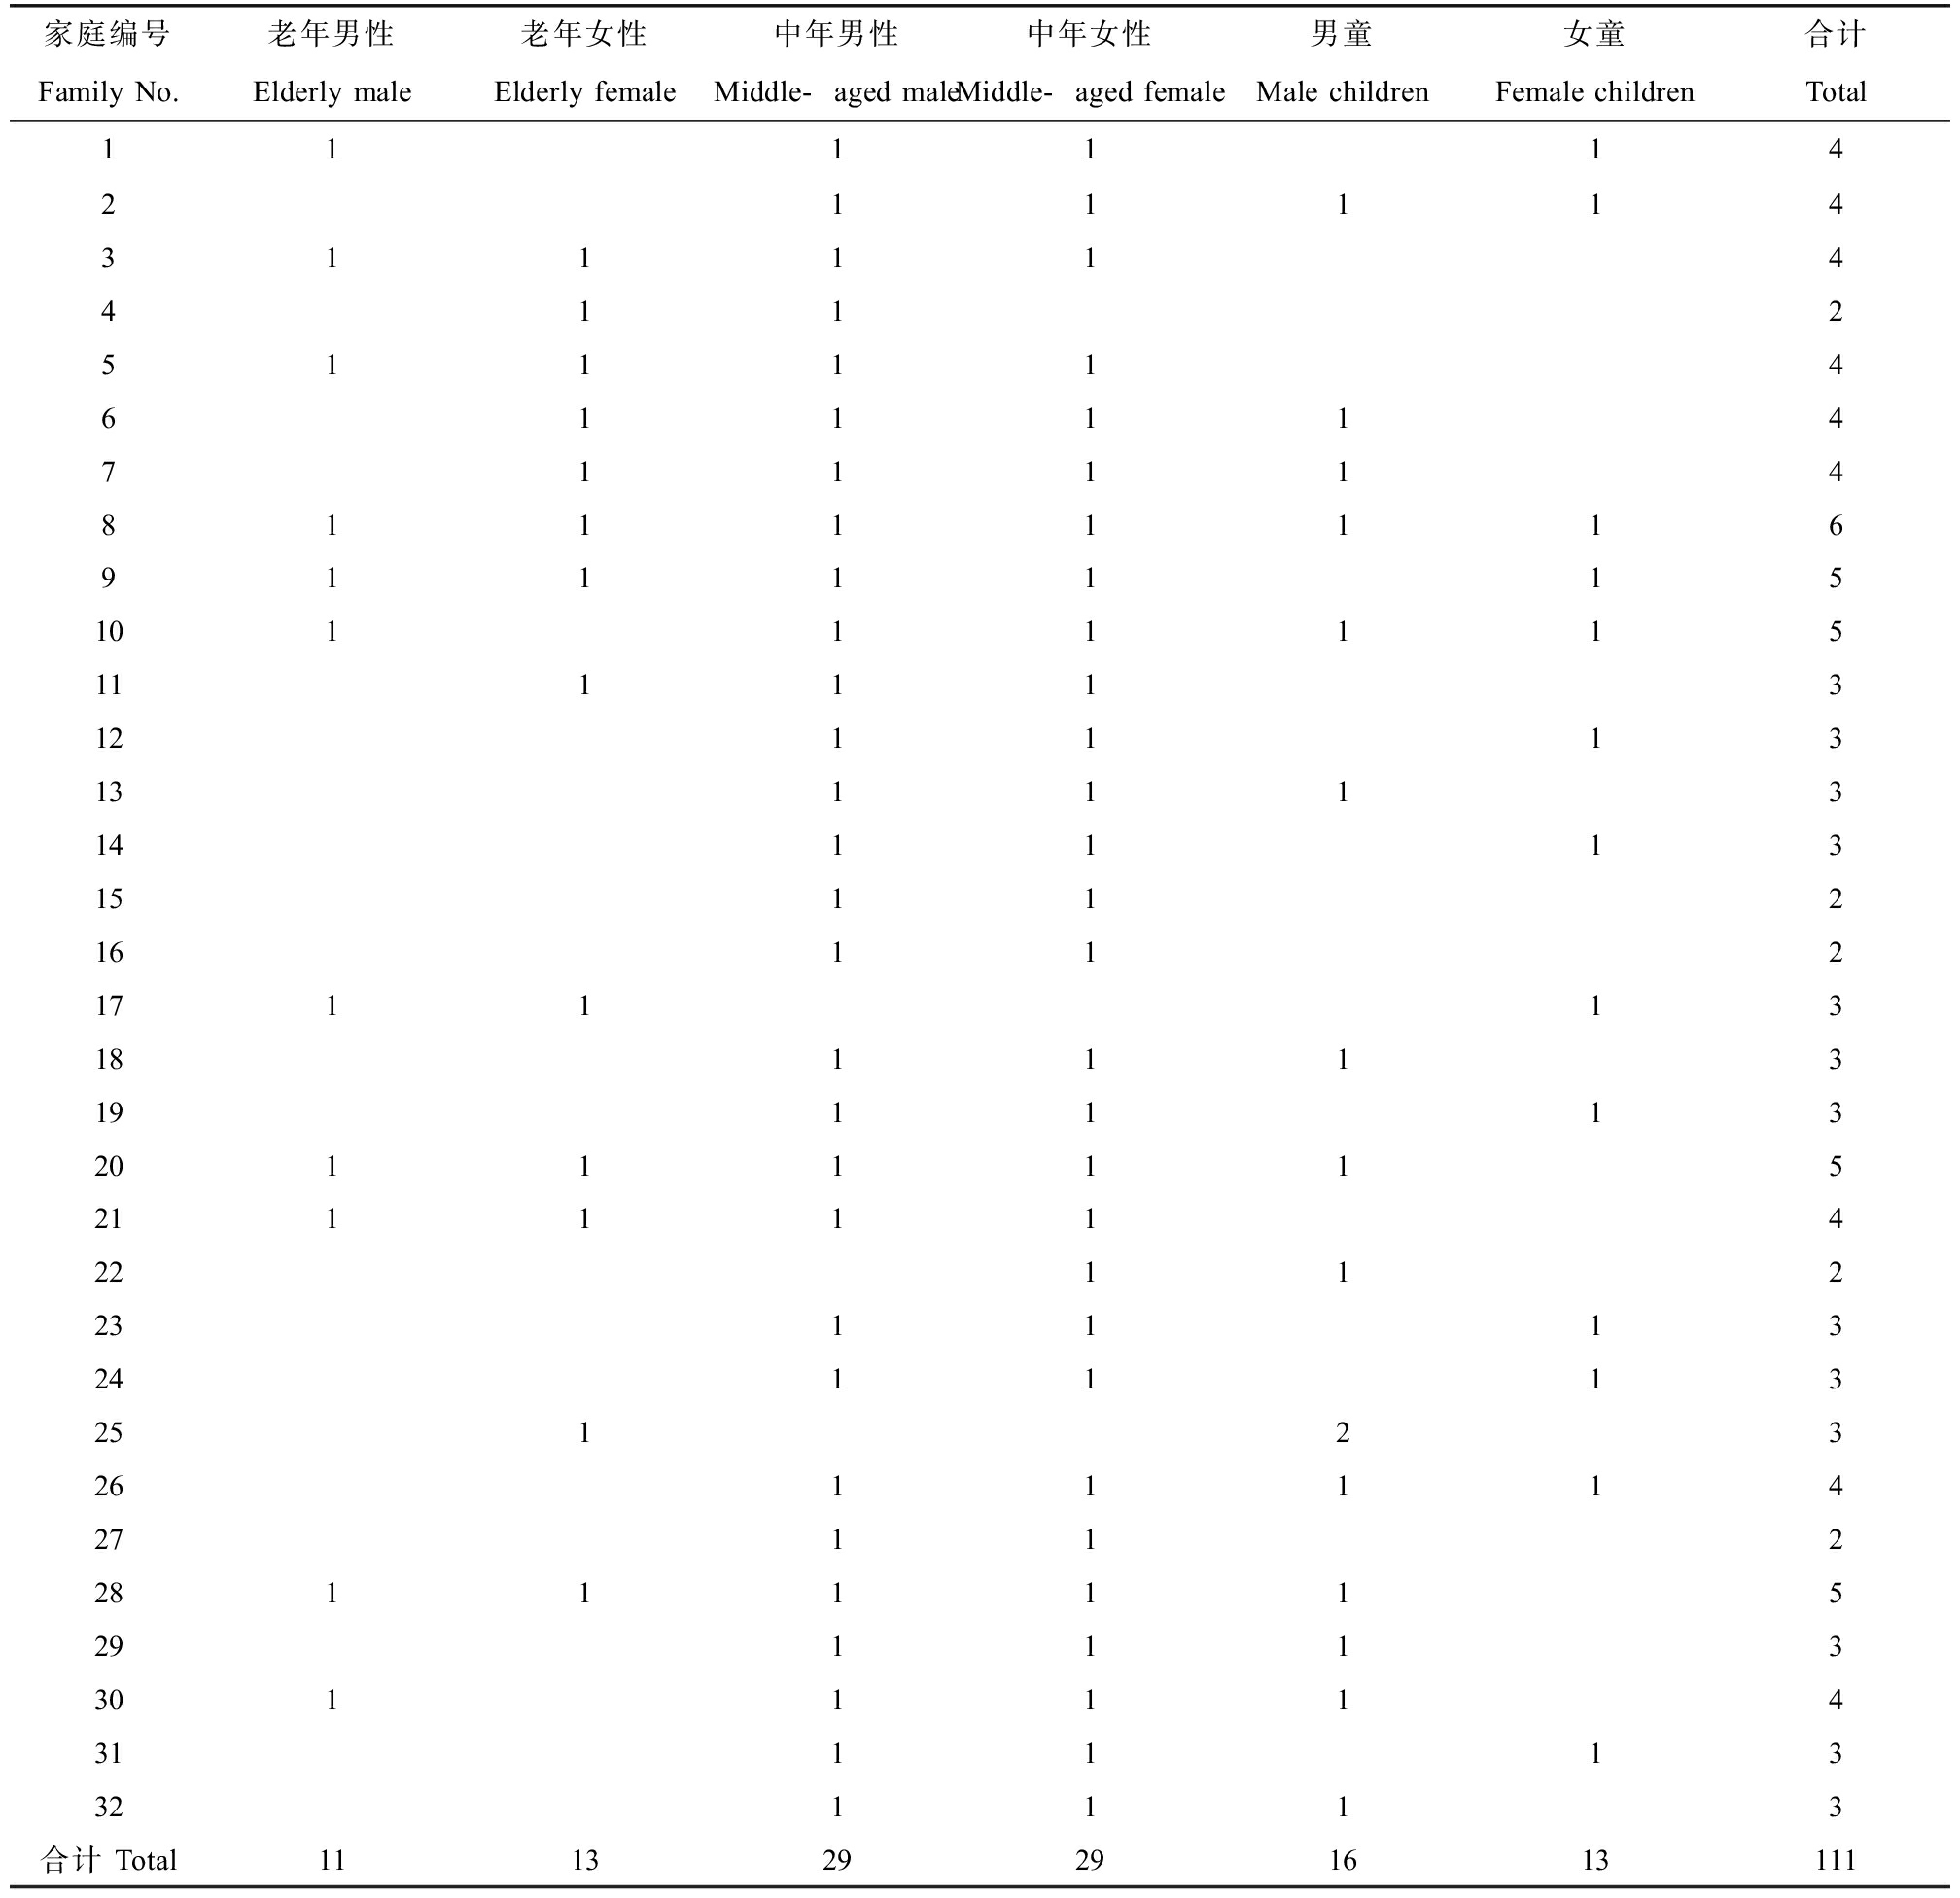
以城市普通白领居民家庭为研究对象,32个志愿者家庭、共计111位城市居民参与本次CO2暴露实验,包含老年24人(男11、女13),中年58人(男29、女29),儿童29人(男16、女13)。表1为受试志愿者家庭成员的年龄与性别分布。志愿者家庭住宅建筑样式为多层公寓,建筑年龄为10年,与交通干道的距离约为100 m,居住楼层为1层~22层,户型包括两室一厅、三室一厅和四室一厅。所有家庭厨房均采用天然气或电等清洁能源,配有抽油烟系统且烹饪时打开,烹饪次数为一日2次或者3次。
表1 受试志愿者家庭成员的年龄与性别分布
Table 1 Age and gender distribution of tested volunteer family members (单位:人) (Unit: Person)
家庭编号老年男性老年女性中年男性中年女性男童女童合计Family No.Elderly maleElderly femaleMiddle-aged male Middle-aged femaleMale childrenFemale childrenTotal11111 421111431111441125111146111147111148111111691111151011111511111312111313111314111315112161121711131811131911132011111521111142211223111324111325123261111427112281111152911133011114311113321113合计 Total111329291613111
注:受试志愿者中,老年大于55岁,中年35~45岁,儿童7~12岁。
Note: Among tested volunteers, the elderly were more than 55 years old, the middle-aged were 35~45 years old, and the children were 7~12 years old.
1.2 微环境CO2浓度监测
2021年2月在32个家庭住宅厨房、客厅和卧室安装了CO2实时监测仪(攀藤PMS-A003(A)),仪器固定在涨杆约150 cm处,涨杆固定在与墙壁垂直距离约100 cm的位置。除此之外,在办公室(同住宅中仪器的安装位置)、车内副驾驶、社区便利店外都安装了该仪器,以获得居民在工作时、驾乘期间和室外活动时的暴露浓度。仪器采集数据的频率为2 min采集1次(车内CO2仅在驾乘期间监测),采集时间为24 h。
1.3 居民活动轨迹调查
111位志愿者居民填写时间活动模式调查表,记录采集数据期间居民在各微环境的停留时间及活动情况。数据采集完毕并回收设备时,研究人员与志愿者面对面交谈完善调查表。
1.4 数据分析处理
将居民24 h内的暴露环境、暴露时长与监测到的CO2实时浓度相匹配,绘制居民CO2实时暴露曲线。进一步分析数据,探究城市居民CO2暴露特征、家庭个体暴露差异和不同微环境对居民CO2暴露贡献以及暴露强度。
(1)居民在某一特定微环境Ei中的暴露时间占比计算公式为:
(1)
式中:PEi为居民在某一特定微环境Ei中的暴露总时长占监测总时长的百分比;TEi为居民在某一特定微环境Ei中的暴露总时长(min);1440为监测总时长(min)。
(2)某一特定微环境Ei对居民24 h总暴露量贡献比计算公式为:
(2)
式中:CEi为某一特定微环境Ei对居民24 h总暴露量贡献比;t1、t2为居民在某一特定微环境中Ei中起始暴露时间、终止暴露时间;CCO2为某一特定微环境中的CO2实时浓度(mg·L-1)。
(3)居民在某一特定微环境Ei中的暴露强度DEi计算公式为:
(3)
2 结果(Results)
2.1 微环境CO2浓度
本研究监测到的32个城市家庭住宅室内CO2日均浓度为(624±346) mg·L-1,低于工业区附近住宅室内日均浓度748 mg·L-1以及使用固体燃料的农村地区住宅室内日均浓度750 mg·L-1 [19-20]。图1为居民主要活动微环境中CO2浓度分布箱线图。住宅室内不同微环境CO2日均浓度分别为:厨房(591±296) mg·L-1,客厅(550±180) mg·L-1,卧室(709±466) mg·L-1。除此之外,室外CO2日均浓度为(307±92) mg·L-1,办公室为(433±142) mg·L-1,车内(驾乘期间)为(1 254±576) mg·L-1。车内CO2浓度最高,有研究发现,在车窗完全关闭、车内有一人的驾驶条件下,车内CO2浓度在30 min后便可达到2 500 mg·L-1 [21];车内有2人时,可达到5 000 mg·L-1 [22]。高浓度CO2易引起驾驶疲劳[23-24],在驾驶时打开车窗,能使车内CO2浓度水平保持在400 mg·L-1左右[21]。室内CO2浓度明显高于室外,室内CO2主要来源是人类呼吸和烹饪,并且前者贡献更大[25-26]。
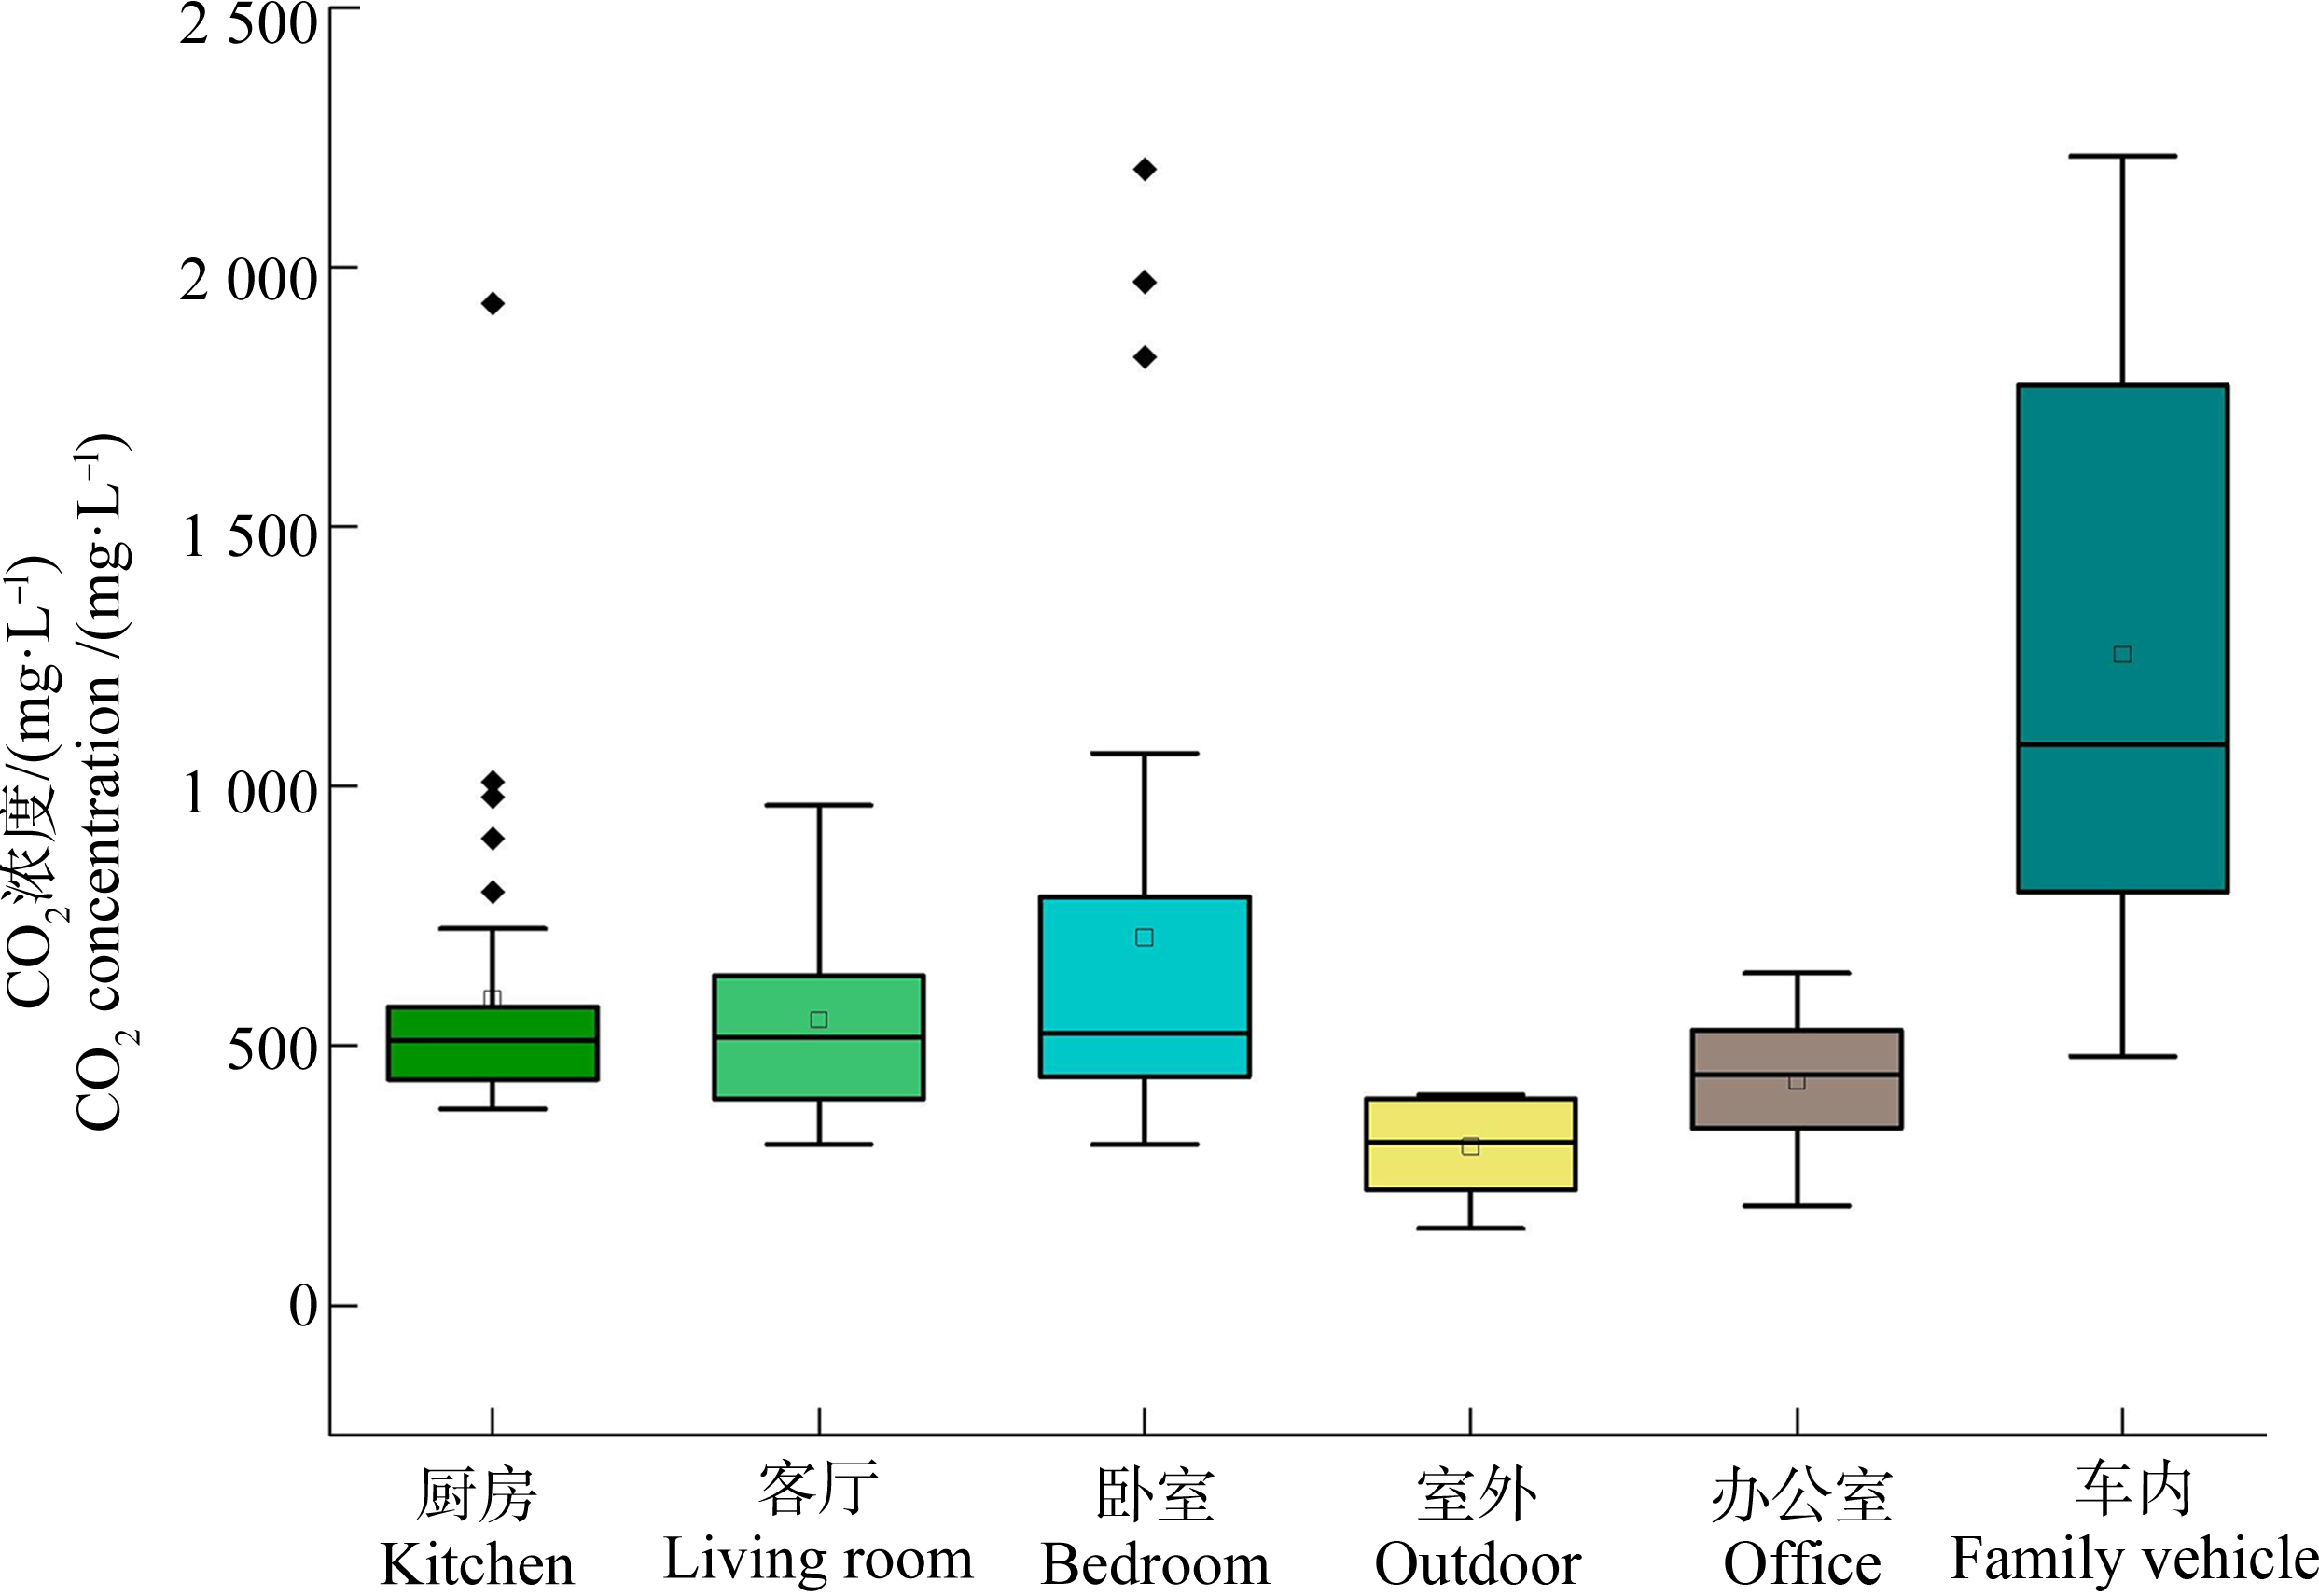
图1 不同微环境CO2日均浓度分布
注:车内浓度指驾乘期间浓度平均值。
Fig. 1 Distributions of daily averaged CO2 concentrations of different microenvironments
Note: The concentration in the family vehicle referred to the average concentration in the driving state.
2.2 CO2日内暴露浓度
为了更好描述城市居民家庭成员CO2暴露个体差异,将受试居民按照年龄、性别分为老年男性、老年女性、中年男性、中年女性、男童和女童6个群体。结合微环境CO2实时浓度与活动轨迹,绘制居民CO2日均暴露浓度频率分布图(图2)。由图2可知,86.5%(96名)的居民CO2日均暴露浓度<1 000 mg·L-1,符合《室内空气质量标准》[7]规定;13.5%(15名)的居民存在过度暴露风险,日均暴露浓度>1 000 mg·L-1。这其中包含4个不同家庭中的2名老年男性、2名老年女性、4名中年男性、4名中年女性和3名男童,其日均暴露浓度为(2 652±647) mg·L-1。从绝对数量上看,中年群体中存在过度暴露风险的人数最多,但从相对比例上看,存在过度暴露风险的老年男性和男童占比相对较大,分别为18.1%和18.8%。而老年女性、中年男性和中年女性所占比例分别为15.4%、13.8%和13.8%。根据调查问卷,存在过度暴露风险的群体在夜间睡眠期间关闭门窗,卧室CO2浓度水平随时间线性增加[27]。有研究发现,CO2浓度每增加100 mg·L-1,睡眠质量下降4.3%[28]。因此居民在夜间休息时,应注意选择性打开门窗降低卧室内CO2浓度[29]。
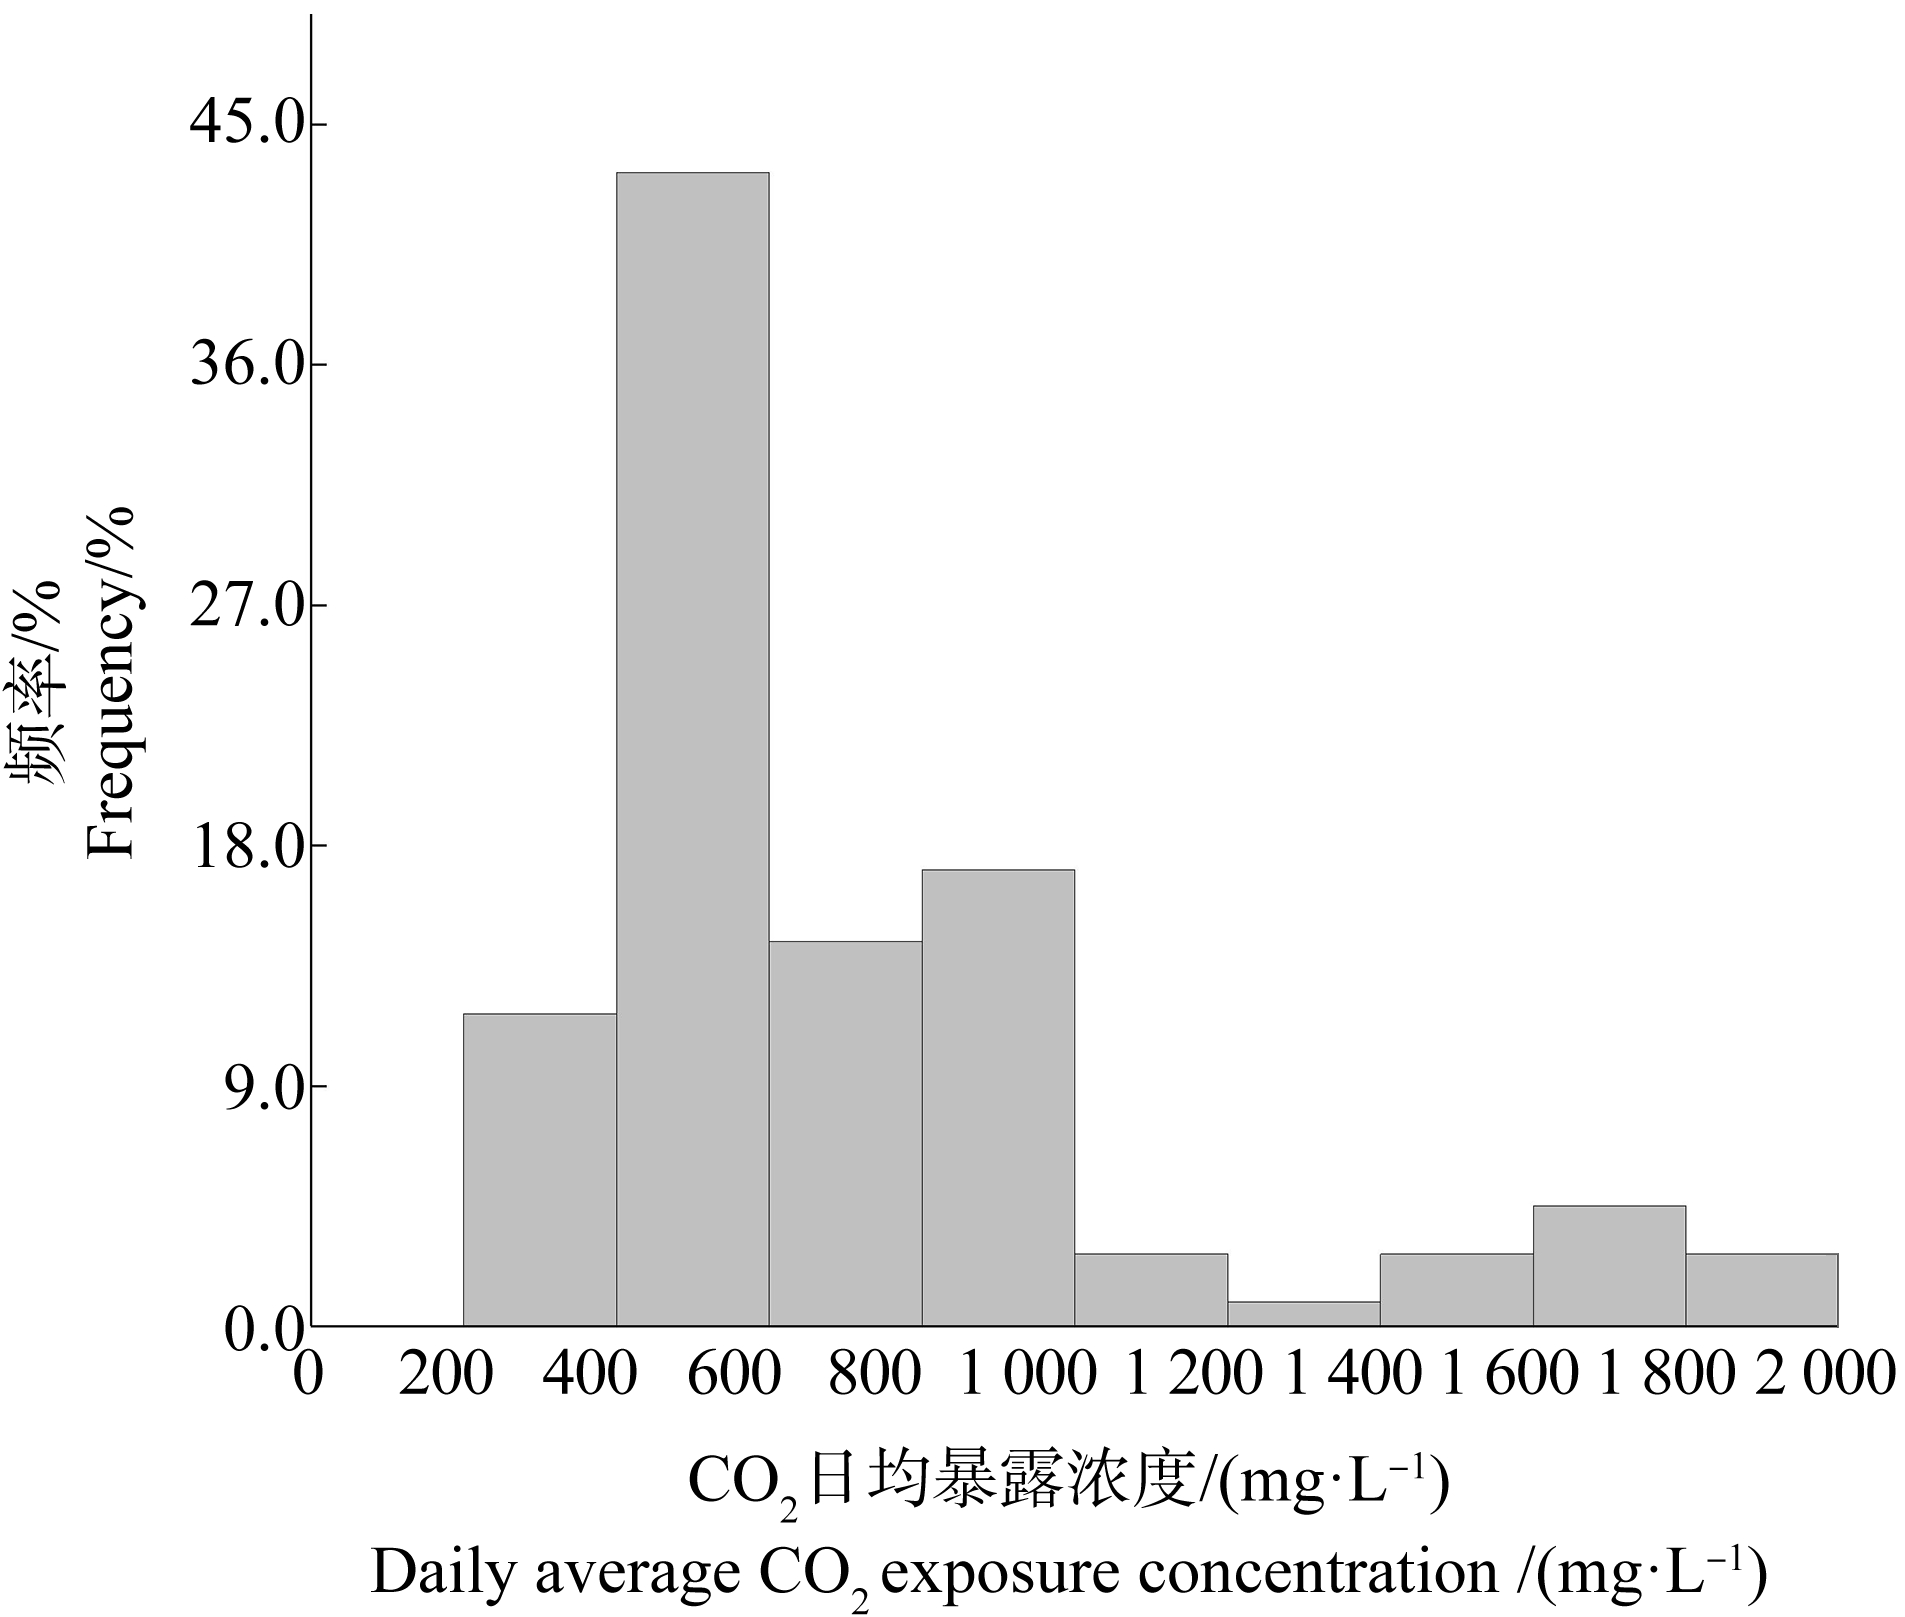
图2 居民CO2日均暴露浓度频率分布
Fig. 2 Daily average CO2 exposure concentration frequency distribution of residents
2.3 短期CO2高浓度暴露风险
各群体于不同浓度CO2中日内暴露时长如图3所示。尽管86.5%的居民日均暴露浓度未超过标准1 000 mg·L-1,但如图3所示所有受试居民都存在短期CO2高浓度(>1 000 mg·L-1)暴露风险,尤其是老年群体暴露于1 000 mg·L-1以上浓度CO2的日内累计时间最长。具体而言,老年男性、老年女性、中年男性、中年女性、男童和女童暴露于1 000 mg·L-1以上浓度CO2日内累计时长分别为11.2、9.4、7.2、6.3、6.5和5.4 h。研究表明,暴露于1 000 mg·L-1浓度CO2中,2.5 h后人的认知、决策和问题解决能力显著下降[6,9]。鉴于老年人认知、决策和问题解决能力均有所下降,其短期CO2高浓度暴露风险应重点关注。此外,本研究也表明使用日均暴露浓度评价CO2暴露风险会隐藏短期CO2高浓度暴露风险。

图3 各群体于不同浓度CO2中日内暴露时长
Fig. 3 Duration of exposure of each group to different concentrations of CO2 within one day
2.4 家庭成员CO2暴露差异
选取1个家庭为代表,耦合微环境CO2实时浓度与居民活动轨迹,绘制家庭成员CO2实时暴露曲线。由图4可知,家庭成员CO2实时暴露呈现出明显的个体差异性,暴露浓度和暴露峰值均存在明显的时空差异。老年男性和老年女性的CO2日均暴露浓度显著高于其他家庭成员,主要归因于夜间卧室内的高浓度暴露。相对而言,CO2暴露风险最低的是儿童,但其暴露峰值仍在卧室。中年男性暴露峰值出现在车内,中年女性暴露峰值则出现在厨房烹饪期间[25]。
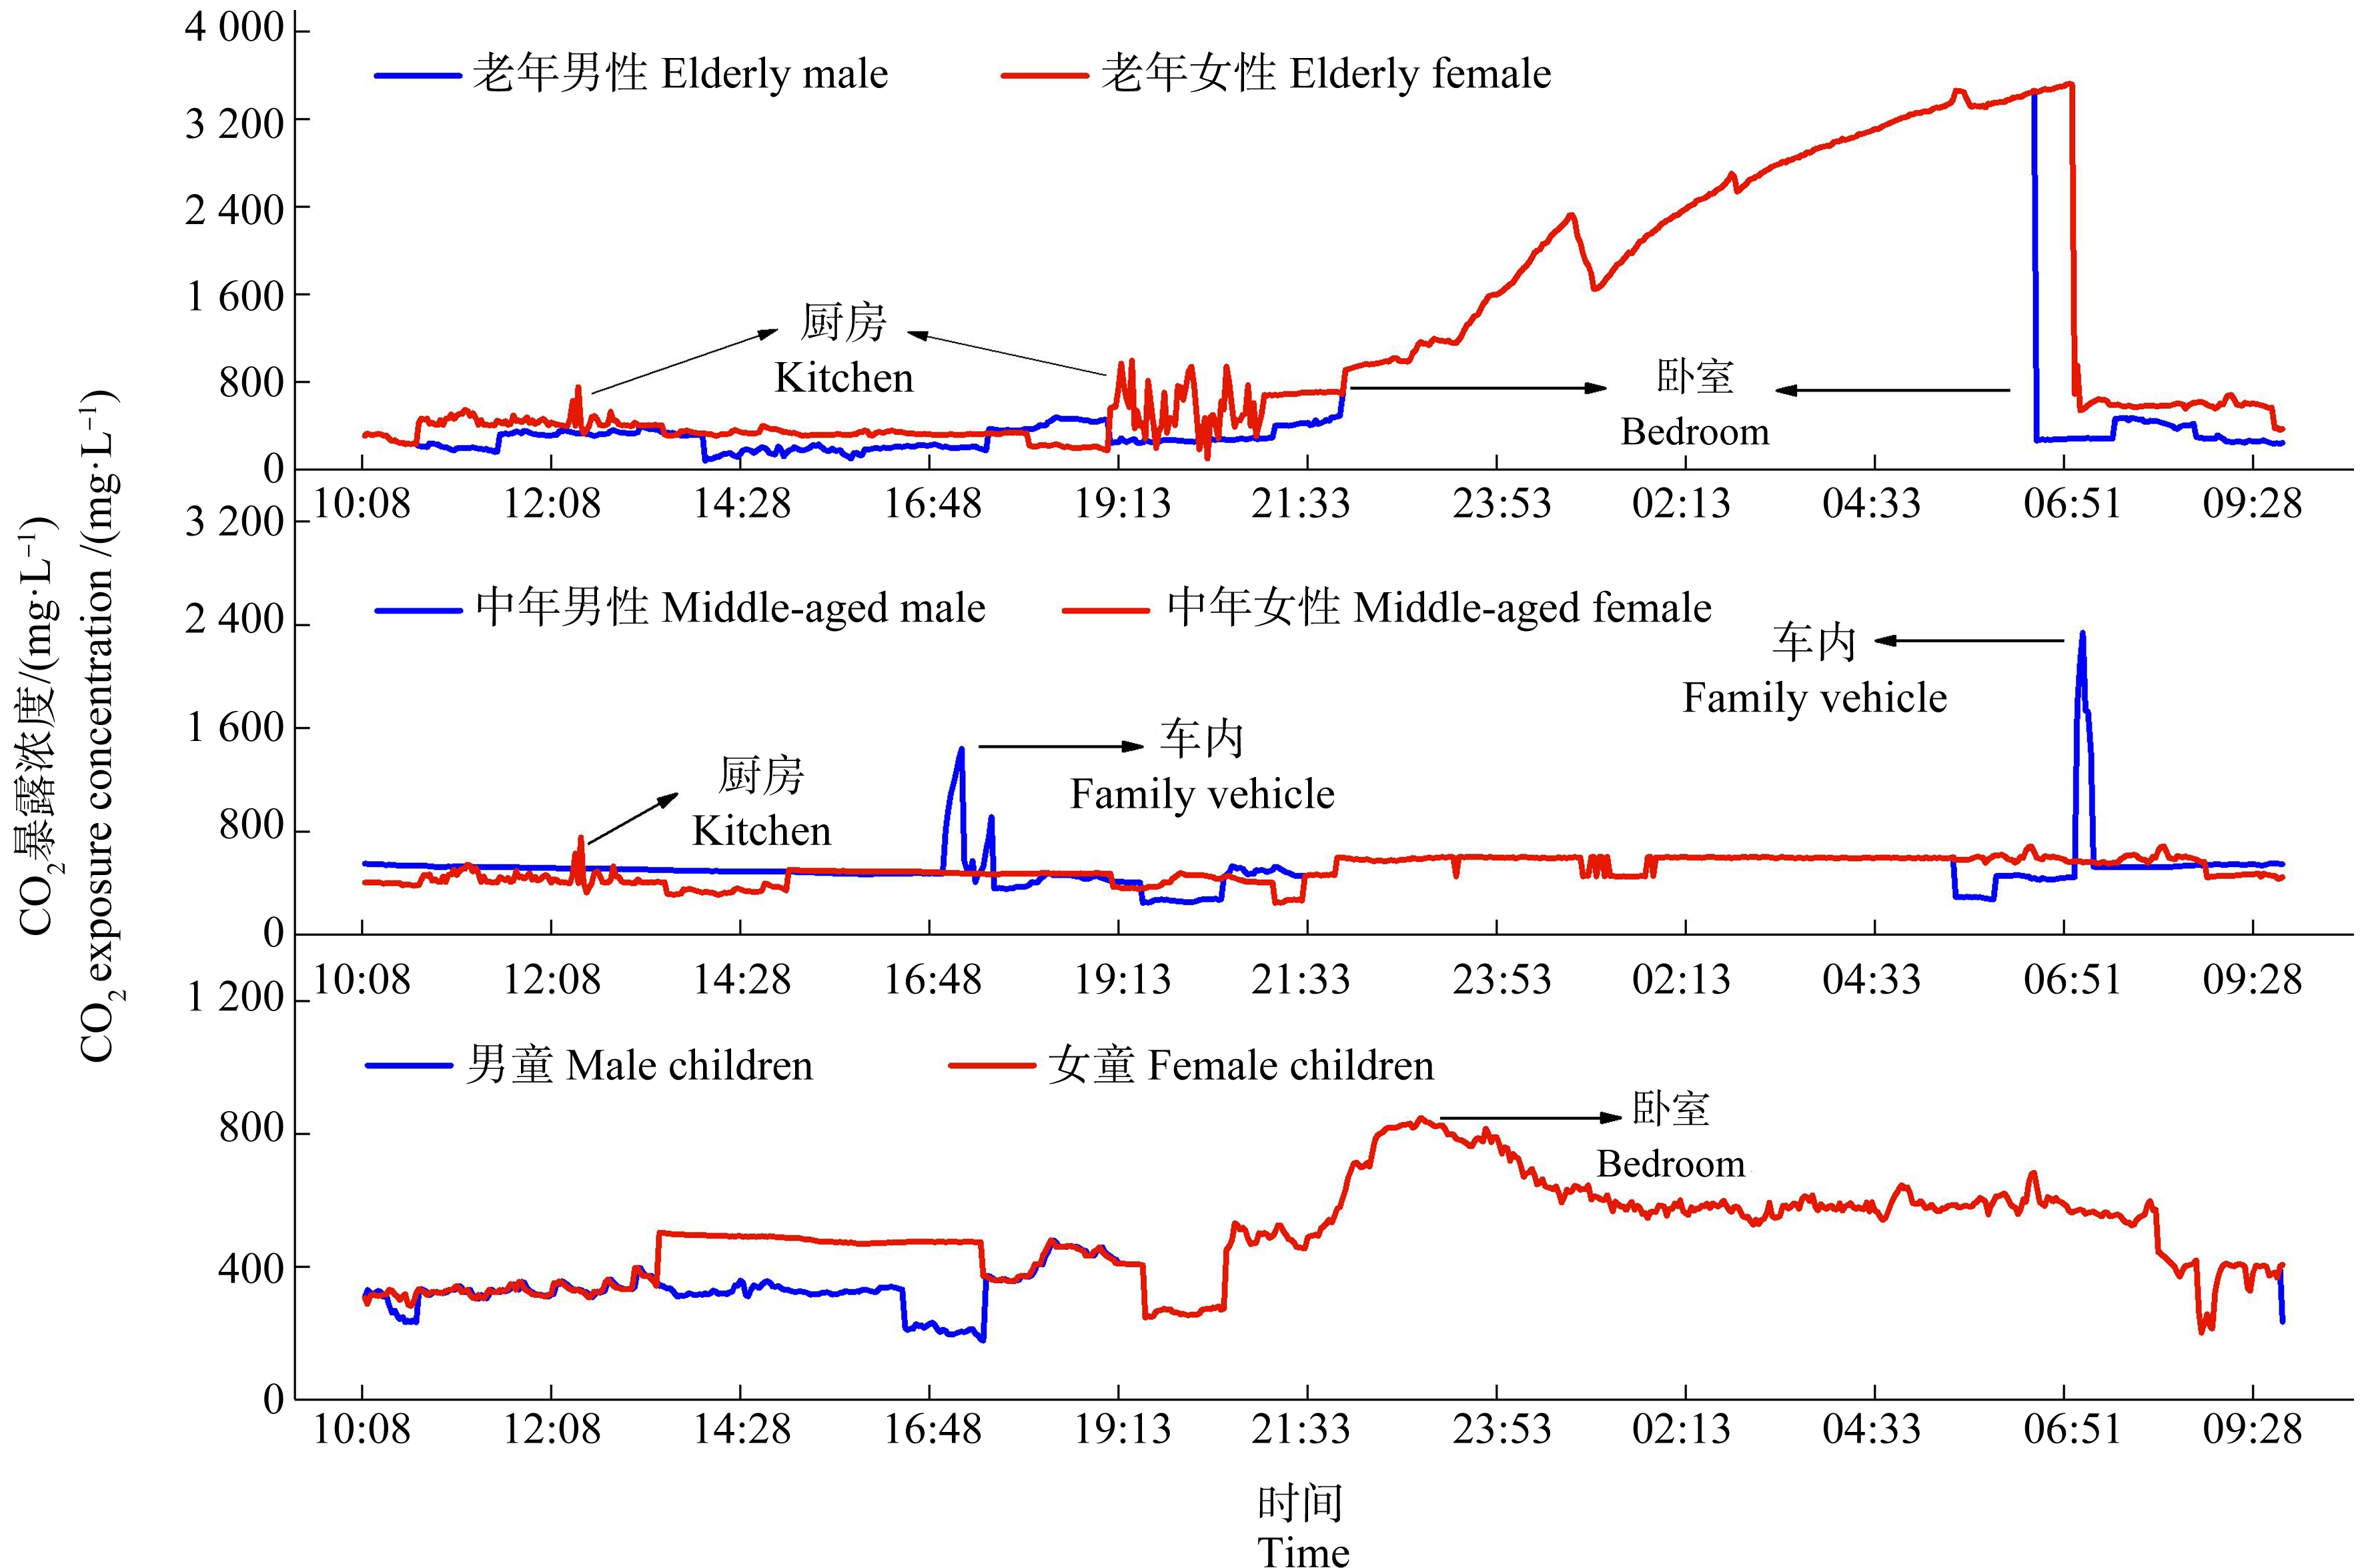
图4 一个家庭成员CO2实时暴露曲线
Fig. 4 Real-time CO2 exposure curves of all members in one family
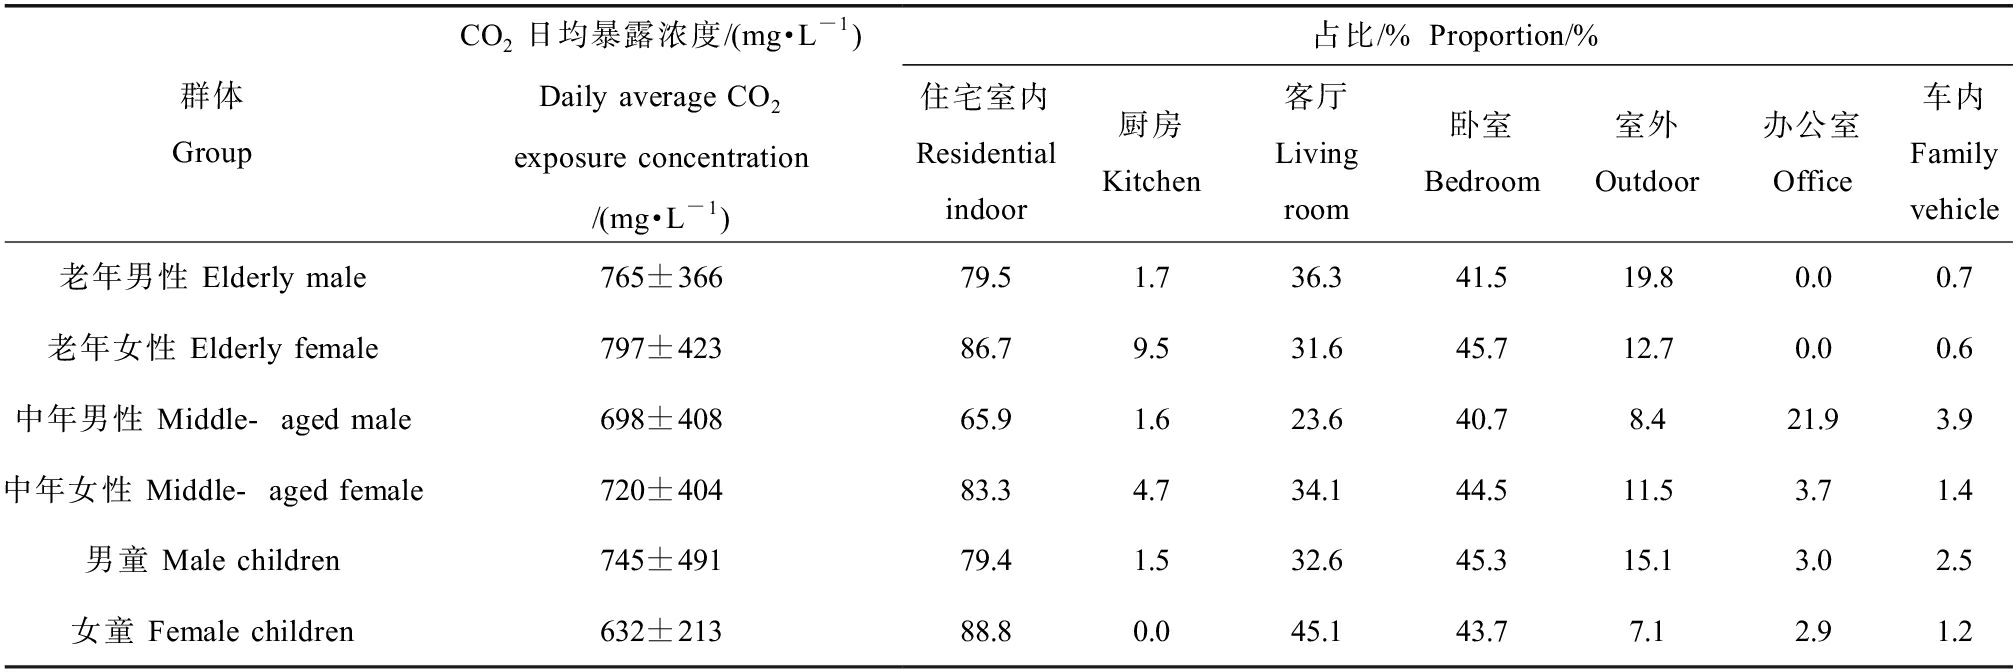
为进一步分析家庭成员个体暴露差异,分类计算32个志愿者家庭中各群体日均暴露浓度及在各微环境暴露时间占比(表2)。111个受试居民CO2日均暴露浓度为(719±391) mg·L-1,暴露水平与年龄呈正相关,老年、中年和儿童日均暴露浓度为(781±387)、(709±403)和(693±385) mg·L-1。除了年龄,性别也是CO2暴露的重要影响因素。如表2所示,所有居民在住宅室内日均暴露时间占比最高(≥65.9%),可见室内CO2浓度水平是个体CO2暴露的主要决定因素,这与已有研究结果相似[30-31]。老年群体与儿童在室内暴露时间最长且占比相当,但老年卧室因通风问题CO2浓度通常偏高(图4),再叠加烹饪等高暴露过程导致他们日均暴露浓度高于儿童。老年和中年群体中,女性在住宅室内暴露时间比男性长,尤其是在厨房暴露时长的显著差异导致女性日均暴露浓度高于男性。
表2 各群体CO2日均暴露浓度及日内在各微环境暴露时间占比
Table 2 Daily-averaged exposure concentration of each group and proportion of exposure time in each microenvironment within one day
群体GroupCO2日均暴露浓度/(mg·L-1) Daily average CO2exposure concentration/(mg·L-1)占比/% Proportion/%住宅室内Residential indoor厨房Kitchen客厅Living room卧室Bedroom室外Outdoor办公室Office车内Family vehicle老年男性 Elderly male765±36679.51.736.341.519.80.00.7老年女性 Elderly female797±42386.79.531.645.712.70.00.6中年男性 Middle-aged male698±40865.91.623.640.78.421.93.9中年女性 Middle-aged female720±40483.34.734.144.511.53.71.4男童 Male children745±49179.41.532.645.315.13.02.5女童 Female children632±21388.80.045.143.77.12.91.2
注:儿童随老年和中年一起,有在厨房和办公室的活动轨迹。
Note: Children, along with the elderly and middle-aged, had a track of activities in the kitchen and office.
值得注意的是,本研究数据采集是在寒假期间进行,儿童在住宅室内暴露时间总占比较就学期间增加。与住宅室内相比,教室内因人口密集通常CO2浓度更高(705~6 821 mg·L-1)[32],因此儿童就学期间短期CO2高浓度暴露风险会相应增加。
2.5 微环境暴露贡献比
由图5可知,各微环境对不同群体CO2暴露贡献,即居民在某一特定微环境中CO2暴露量与每日总暴露量的比值。卧室对所有群体暴露贡献最大,平均贡献为54.65%,与已有研究结果一致[33];其次是客厅,平均贡献为30.73%。因此,为降低卧室和客厅CO2暴露风险,卧室和客厅需保持通风,必要时可使用空气净化器[34-35]。厨房、室外、办公室和车内对居民的暴露贡献在不同群体之间呈现出差异性。男性倾向于花更长时间在工作、社交和外出等活动上[36]。相对于其他居民群体,办公室和车内对中年男性暴露贡献更大,室外对老年男性暴露贡献更大。女性是家庭烹饪的主体[36],因此厨房对中年、老年女性的暴露贡献通常更大。总体而言,室内微环境对居民CO2暴露贡献大于室外,卧室和客厅是居民CO2暴露的主要来源。

图5 微环境对居民CO2暴露贡献比
Fig. 5 The contribution ratio of different microenvironments to CO2 exposure of residents
2.6 微环境暴露强度
暴露强度量化了某微环境单位时间对居民CO2暴露贡献比。当值为1时,意味着居民在该微环境中CO2暴露水平与日均暴露水平相当;值>1,说明居民在该环境下暴露水平大于日均暴露水平。不同群体在各微环境中的CO2暴露强度如图6所示,所有居民在卧室的暴露强度均在1以上,平均暴露强度为1.24。在车内平均暴露强度达到2.06,47.6%(占有车内活动轨迹的居民人数比例)的居民在车内暴露强度>2。这表明,相对于其他环境,居民在卧室、车内活动期间CO2暴露风险更高。因此,居民在卧室和车内的CO2暴露值得关注,若不能减少在卧室、车内暴露时间,居民有必要降低这2个微环境中的CO2浓度。
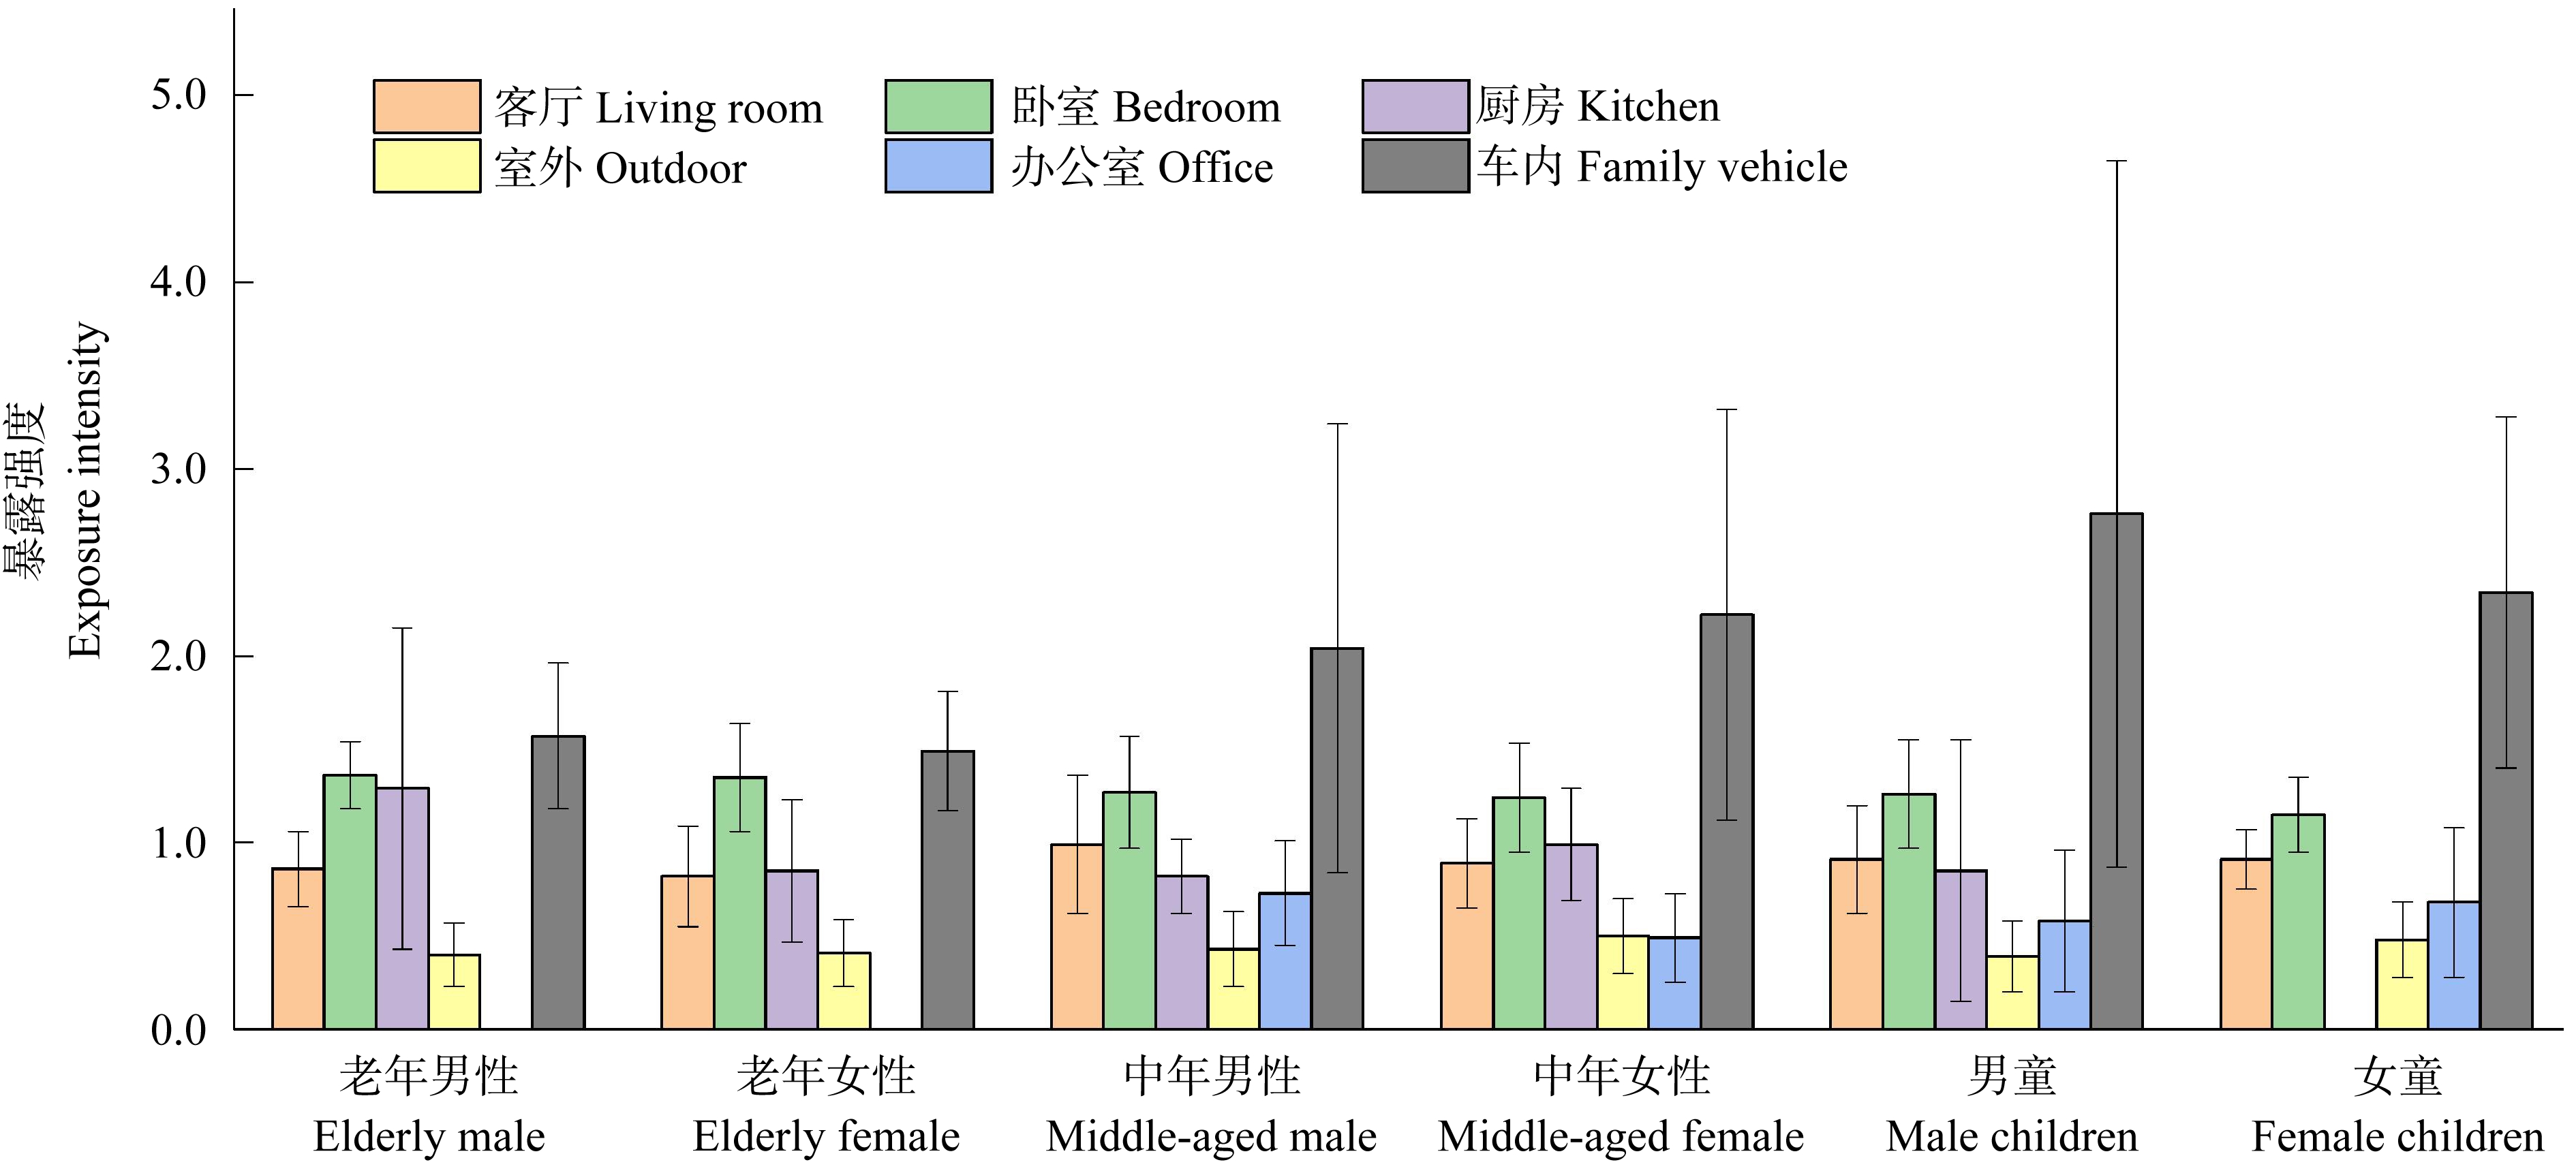
图6 居民在不同微环境中的暴露强度
Fig. 6 The exposure intensity of residents in different microenvironments
3 讨论(Discussion)
就日均暴露浓度而言,86.5%的城市居民不存在CO2过度暴露风险(日均暴露浓度<1 000 mg·L-1);但从个体实时暴露上看,受试群体都存在短期CO2高浓度暴露风险(实时暴露浓度>1 000 mg·L-1)。使用日均暴露浓度评价CO2暴露风险会隐藏短期CO2高浓度暴露风险。家庭成员CO2暴露存在显著个体差异性,日均暴露浓度与年龄呈正相关,并且存在性别差异。男童日均暴露浓度高于女童,而老年和中年群体中女性日均暴露浓度高于男性。卧室、客厅、车内和厨房微环境的暴露值得重点关注,控制其CO2浓度可有效减少居民个体CO2暴露风险(选择性或周期性通风)。尤其应着力减少老年群体在卧室休息和厨房烹饪过程中CO2实时暴露风险。此外,规避不必要的峰值暴露也是降低居民个体CO2暴露风险的重要途径。如在烹饪过程中,不光要考虑通过开窗、开门或开启抽油烟系统改善通风条件,降低烹饪者CO2过度暴露风险[37],还应关注厨房CO2在室内其他微环境中的快速扩散风险[38],并主动规避其他群体(特别是儿童)在厨房内的不必要聚集。
[1] 赵姗. “双碳”战略引领绿色发展道路[N]. 中国经济时报, 2021-12-31(1)
[2] Jenkinson D S, Adams D E, Wild A. Model estimates of CO2 emissions from soil in response to global warming [J]. Nature, 1991, 351(6324): 304-306
[3] Delangiz N, Varjovi M B, Lajayer B A, et al. The potential of biotechnology for mitigation of greenhouse gasses effects: Solutions, challenges, and future perspectives [J]. Arabian Journal of Geosciences, 2019, 12(5): 174
[4] 凌定元. 温室效应危害及治理措施[J]. 纳税, 2018(13): 252
[5] Robertson D S. The rise in the atmospheric concentration of carbon dioxide and the effects on human health [J]. Medical Hypotheses, 2001, 56(4): 513-518
[6] Satish U, Mendell M J, Shekhar K, et al. Is CO2 an indoor pollutant? Direct effects of low-to-moderate CO2 concentrations on human decision-making performance [J]. Environmental Health Perspectives, 2012, 120(12): 1671-1677
[7] 国家质量监督检验检疫总局, 卫生部. 室内空气质量标准: GB/T 18883—2002[S]. 北京: 中国标准出版社, 2003
[8] 曹聪霄, 邓辉, 庞锋, 等. 低浓度二氧化碳吸附材料及其再生技术研究[C]//中国化学会.·第一届全国二氧化碳资源化利用学术会议摘要集. 天津: 中国化学会, 2019: 163
[9] Allen J G, MacNaughton P, Satish U, et al. Associations of cognitive function scores with carbon dioxide, ventilation, and volatile organic compound exposures in office workers: A controlled exposure study of green and conventional office environments [J]. Environmental Health Perspectives, 2016, 124(6): 805-812
[10] Zhang J, Pang L P, Cao X D, et al. The effects of elevated carbon dioxide concentration and mental workload on task performance in an enclosed environmental chamber [J]. Building and Environment, 2020, 178: 106938
[11] Wu J D, Weng J T, Xia B, et al. The synergistic effect of PM2.5 and CO2 concentrations on occupant satisfaction and work productivity in a meeting room [J]. International Journal of Environmental Research and Public Health, 2021, 18(8): 4109
[12] Kozielska B, Mainka A, ![]() M, et al. Indoor air quality in residential buildings in Upper Silesia, Poland [J]. Building and Environment, 2020, 177: 106914
M, et al. Indoor air quality in residential buildings in Upper Silesia, Poland [J]. Building and Environment, 2020, 177: 106914
[13] Gabriel M F, Felgueiras F, Batista R, et al. Indoor environmental quality in households of families with infant twins under 1 year of age living in Porto [J]. Environmental Research, 2021, 198: 110477
[14] Gall E T, Cheung T, Luhung I, et al. Real-time monitoring of personal exposures to carbon dioxide [J]. Building and Environment, 2016, 104: 59-67
[15] González Serrano V, Licina D. Longitudinal assessment of personal air pollution clouds in ten home and office environments [J]. Indoor Air, 2022, 32(2): e12993
[16] 赵彤, 孙江, 刘继凤. 室内空气污染现状及处理方法的探讨[J]. 环境科学与管理, 2011, 36(6): 48-49, 88
Zhao T, Sun J, Liu J F. Discussion on status quo of indoor air pollution and disposal method [J]. Environmental Science and Management, 2011, 36(6): 48-49, 88 (in Chinese)
[17] 王春梅, 陶晶, 李婷, 等. 北京城市居民冬季个体暴露PM2.5中多环芳烃特征与室外的差异研究[J]. 环境与健康杂志, 2021, 38(3): 215-219
Wang C M, Tao J, Li T, et al. Differences on characteristics between personal and outdoor exposure to polycyclic aromatic hydrocarbons in PM2.5 for urban residents in winter in Beijing [J]. Journal of Environment and Health, 2021, 38(3): 215-219 (in Chinese)
[18] Yun X, Shen G F, Shen H Z, et al. Residential solid fuel emissions contribute significantly to air pollution and associated health impacts in China [J]. Science Advances, 2020, 6(44): eaba7621
[19] Mentese S, Tasdibi D. Assessment of residential exposure to volatile organic compounds (VOCs) and carbon dioxide (CO2) [J]. Global Nest Journal, 2017, 19(4): 726-732
[20] Li Y J, Liu X L, Men Y T, et al. Indoor coal combustion for heating exacerbates CO2 exposure approaching harmful levels [J]. Environmental Science &Technology Letters, 2021, 8(10): 861-866
[21] Moreno T, Pacitto A, Fernández A, et al. Vehicle interior air quality conditions when travelling by taxi [J]. Environmental Research, 2019, 172: 529-542
[22] Gun K H, Yu Y H, Yang X P, et al. Carbon dioxide (CO2) concentrations and activated carbon fiber filters in passenger vehicles in urban areas of Jeonju, Korea [J]. Carbon Letters, 2018, 26(1): 74-80
[23] Hudda N, Fruin S A. Carbon dioxide accumulation inside vehicles: The effect of ventilation and driving conditions [J]. Science of the Total Environment, 2018, 610-611: 1448-1456
[24] Maga a V C, Scherz W D, Seepold R, et al. The effects of the driver’s mental state and passenger compartment conditions on driving performance and driving stress [J]. Sensors, 2020, 20(18): 5274
[25] Shubhanka B, Ambade B. A critical comparative study of indoor air pollution from household cooking fuels and its effect on health [J]. Oriental Journal of Chemistry, 2016, 32(1): 473-480
[26] Shen G F, Ainiwaer S, Zhu Y Q, et al. Quantifying source contributions for indoor CO2 and gas pollutants based on the highly resolved sensor data [J]. Environmental Pollution, 2020, 267: 115493
[27] Batog P, Badura M. Dynamic of changes in carbon dioxide concentration in bedrooms [J]. Procedia Engineering, 2013, 57: 175-182
[28] Xiong J, Lan L, Lian Z W, et al. Associations of bedroom temperature and ventilation with sleep quality [J]. Science and Technology for the Built Environment, 2020, 26(9): 1274-1284
[29] Mishra A K, van Ruitenbeek A M, Loomans M G L C, et al. Window/door opening-mediated bedroom ventilation and its impact on sleep quality of healthy, young adults [J]. Indoor Air, 2018, 28(2): 339-351
[30] 王贝贝, 段小丽, 蒋秋静, 等. 我国北方典型地区居民呼吸暴露参数研究[J]. 环境科学研究, 2010, 23(11): 1421-1427
Wang B B, Duan X L, Jiang Q J, et al. Inhalation exposure factors of residents in a typical region in Northern China [J]. Research of Environmental Sciences, 2010, 23(11): 1421-1427 (in Chinese)
[31] Boniardi L, Dons E, Longhi F, et al. Personal exposure to equivalent black carbon in children in Milan, Italy: Time-activity patterns and predictors by season [J]. Environmental Pollution, 2021, 274: 116530
[32] Pegas P N, Alves C A, Evtyugina M G, et al. Indoor air quality in elementary schools of Lisbon in spring [J]. Environmental Geochemistry and Health, 2011, 33(5): 455-468
[33] Almeida-Silva M, Wolterbeek H T, Almeida S M. Elderly exposure to indoor air pollutants [J]. Atmospheric Environment, 2014, 85: 54-63
[34] 蔡来胜, 刘春雁, 刘刚. 活性炭纤维及其在空气净化器中的应用[J]. 上海纺织科技, 2003, 31(4): 10-12
Cai L S, Liu C Y, Liu G. Properties and applications in the air cleaner of activated carbon fiber [J]. Shanghai Textile Science &Technology, 2003, 31(4): 10-12 (in Chinese)
[35] 爱稀奇. 这款空气净化器, 自带绿植吸收二氧化碳[J]. 五金科技, 2018(6): 82-83
[36] Zhong M, Wu C Z, Hunt J D. Gender differences in activity participation, time-of-day and duration choices: New evidence from Calgary [J]. Transportation Planning and Technology, 2012, 35(2): 175-190
[37] Kim H, Kim J S, Lee J, et al. The effect of ventilation on reducing the concentration of hazardous substances in the indoor air of a Korean living environment [J]. Analytical Science &Technology, 2020, 33(1): 49-57
[38] 胡园园, 王志荣, 蒋军成. 自然通风条件下室内CO2扩散浓度变化的数值模拟[J]. 南京工业大学学报(自然科学版), 2012, 34(3): 129-133
Hu Y Y, Wang Z R, Jiang J C. Numerical simulation of indoor concentration change of carbon dioxide dispersion under natural ventilation condition [J]. Journal of Nanjing University of Technology (Natural Science Edition), 2012, 34(3): 129-133 (in Chinese)